Jan 8, 2018 | Constellations, Deep Space Objects, Orbits, Planets & Moons, SciDome Tips, Solar System, Stars
I’m excited to announce that Volume 3 of the Spitz Fulldome Curriculum is being released to all SciDome users, and will of course be automatically incorporated into all future SciDome installations. We thought that this would be an opportune time to give a very brief overview of what’s contained in this volume. There are several revisions to previous minilessons as well as several all new offerings:
Galilean Moons
 This minilesson gives 26 examples (in order of date) of Galileo’s first observations of the four major moons of Jupiter during the winter of 1610. The actual configuration of each night is beautifully displayed on the dome by Starry Night and then Galileo’s sketch is presented directly underneath it so that your audience can compare the sketch to reality. You will be astonished at Galileo’s accuracy, as well as the restrictions of his poor optics and resolution that confined his work. My students enjoy these comparisons even more than I do!
North Celestial Pole (NCP) Altitude
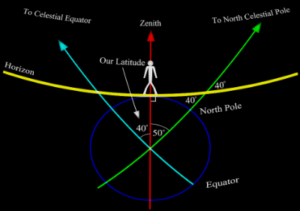
My students always scratch their heads when presented with the idea that the North Celestial Pole is always the same number of degrees above your horizon as your latitude. This series of overlaying diagrams attempts to clearly lay out exactly why this is the case.
Planetary Tilts
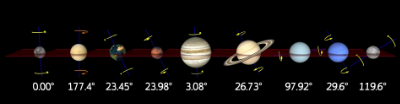
Steve Sanders, Observatory Administrator at Eastern University and my right hand man, came up with this idea to beautifully illustrate the various planetary axis tilts side by side as well as their rotation periods. This animation is so impactful that the folks at ViewSpace used it in one of their presentations last year!
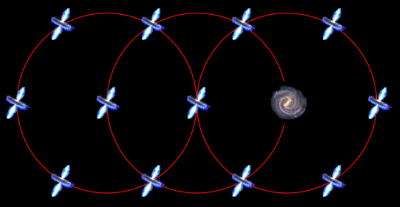
Quasars Fulldome
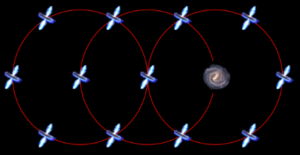
This is one of my all time favorite mind-blowing demonstrations! In a series of overlaying fulldome illustrations (again created by Steve Sanders), the second cosmological principle of the universe looking the same everywhere is demonstrated by using the appearance of quasars as seen from any galaxy, starting from the Milky Way. Your audience will be left awestruck when they discover that the Milky Way is a quasar as seen by a distant galaxy which to us looks like a quasar!
Roemer’s Method Revised
One of my favorite minilessons from Volume 1, we’ve revised this presentation with a new animation by Steve Sanders which very clearly shows the concept behind the light time effect and how Roemer was the first to demonstrate that the speed of light was finite and approximate its value. You can not only show this effect to your audience but make an incredibly precise and straightforward measurement from it of the speed of light!
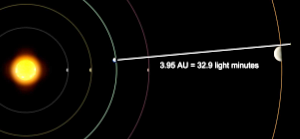
Solar System Scale Revised
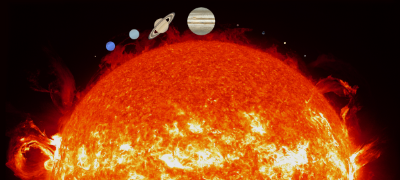 I still use this minilesson in nearly every one of my presentations and for all ages. We have greatly improved the graphics used in this minilesson and I know you will like the results!
Stellar Sizes Revised
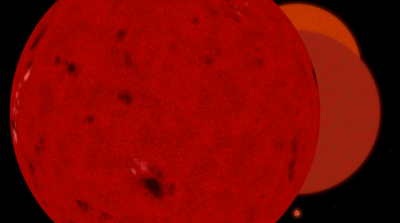 Like Solar System Scale, I use this minilesson frequently in most of my presentations, and we’ve revised it by adding a final graphic at the end which shows VY Canis Majoris in its entirety on the dome in one final scale shift.
Synodic Periods of Mercury, Venus, Mars and Jupiter
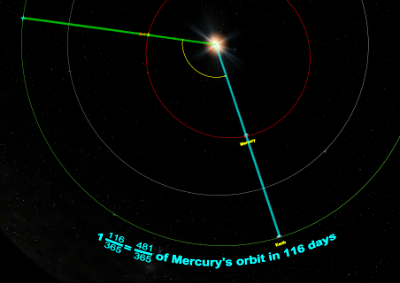 These are my favorite new additions in Volume 3! Each is a separate minilesson and carefully steps the audience through how Copernicus disentangled synodic periods of the planets into their sidereal periods around the Sun! Although very few people have ever been taught this concept, it’s very straightforward and illuminating when you see it on the dome. Test one out for yourself and you’ll be hooked!
Titius-Bode Rule
 We often mention this infamous “Law” in our astronomy classes, so I wanted to present it in a historical fashion to demonstrate what effect it had on astronomer’s thinking when the Solar System was being explored and new planets being discovered. It’s the perfect example of a mathematical oddity that may or may not be scientifically meaningful. I think you will find it a fascinating subject as presented on the dome in this minilesson!
Watery Constellations
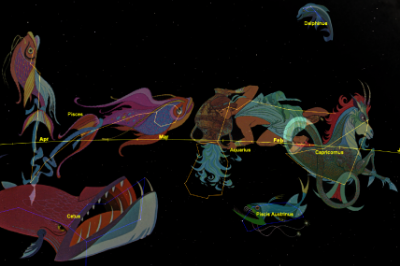
This little minilesson playfully depicts the fact that the region of the sky known as “The Sea” by the ancients has water-related constellations residing in it for a specific reason, namely that the Sun traversed this part of the sky during the rainy season in the Mediterranean. You will also be able to show your audience in a natural way that the position of the winter solstice used to be in Capricorn around 1000 BC, and hence that latitude parallel is called the Tropic of Capricorn.
Perhaps the greatest contribution to the official contents of Volume 3 is the availability of three unique fulldome interactive programs: Epicycles, Newton’s Mountain, and Tides. These three programs allow you to clearly demonstrate subjects which I have found extremely challenging for my students:
- Epicycles shows many of the intricacies and systematics of the simplified Ptolemaic geocentric system and will alert your audiences to the vagaries of “saving the model at any cost.”
- Newton’s Mountain is a 21st century interactive version of Newton’s attempt to explain exactly what an orbit is allowing you to show your audience in real time different orbits as a cannonball literally falls around the Earth.
- Tides shows exactly why the Moon causes the water to bulge on either side of the Earth via differential gravitational forces as well as demonstrating that the bulge is not the same on both sides!
REQUIRES WINDOWS 7 ON THE RENDERBOX COMPUTER. Multi-projector systems must be based on Scaleable – not compatible with EasyBlend.
These three programs require purchase because of the many years of work which went into their development and implementation. They are now available for online purchase and immediate download:
Purchase Astrophyics Apps
I hope that you and your audiences thoroughly enjoy this latest addition to the Fulldome Curriculum, and that they will be helpful as you continue to strive to educate people in the subjects that we all love.
Oct 18, 2017 | Artificial Satellites, Constellations, Pop Culture
As the NFL season gets into gear (Go Bills!) it’s time to mention football’s deep connections with astronomy.
The 1927 Broadway musical Good News, which gave us the popular song “The Moon Belongs To Everyone”, is about the division in college life between sports and astronomy, as the male lead of the play tries to skip out on astronomy class to help the school team win the football game.
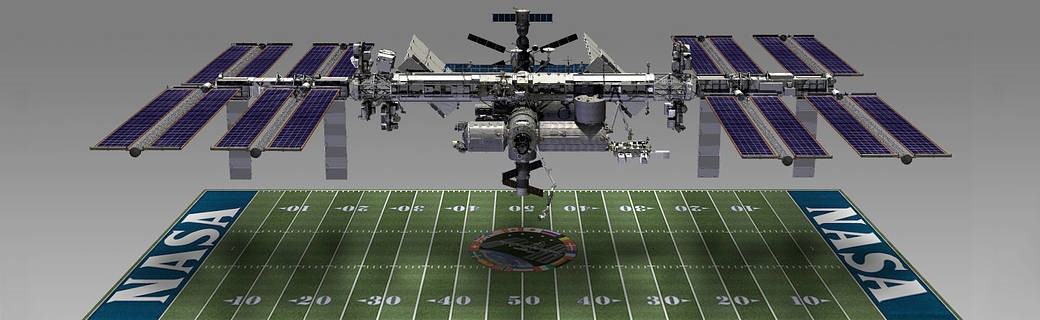
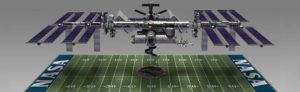 The area of a football field is often used as an astronomical scale, to point out that the International Space Station is about 1.3 yards shorter than the length of an American football field, or to use various kinds of fresh fruit to simulate the size of the Solar System (not to scale.)
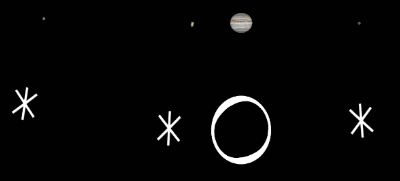
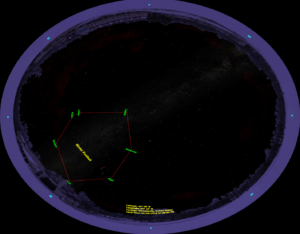
One of my favorite asterisms that isn’t included in the Starry Night gallery for SciDome planetariums so far is the Winter Football. There is a Winter Triangle asterism that is drawn between the bright winter stars Betelgeuse, and Sirius and Procyon, but the Winter Football is much better. If you can imagine a shape drawn between Sirius, Procyon, Pollux, Castor, Capella, Aldebaran and Rigel, it looks roughly football-shaped. For the full conversion, the stars that make up Orion’s Belt can be the stitching. The open-source nature of Starry Night allows the user to create new asterisms like this.
 To illustrate the Winter Football on SciDome, download this zipped folder with three files: Winter Football.txt is a short code file that describes the lines drawn between these stars, and the label of the asterism. This file was built using the same template used by Dr. Bradstreet in his Spitz Institute lesson about building custom asterisms.
The second file is a .PNG slide of a cartoon football with a transparent background. For extra verisimilitude, after the stick figure of the football is highlighted on the sky, ATM-4 can be used to bring up the details of the football itself.
The third file is an image with the Winter Football asterism highlighted, showing the sky as it will appear during Super Bowl LII on the 1st Sunday in February of next year.
To use this file in an updated Starry Night Dome 7 for SciDome, it should be added to the folder location:
C:\ProgramData\Simulation Curriculum\Starry Night Prefs\Sky Data\Asterisms\Winter Football.txt
In older SciDomes it may be necessary to load it onto folders on Preflight and Renderbox computers in two separate steps. Please contact me at Spitz Support for details.
The football slide can be used from an appropriately named subfolder of your Preflight desktop shortcut Slides folder. It should work well in semitransparent mode.
All of these uses of getting sports fans interested in astronomy carry no risk of personal injury.
Sep 21, 2015 | Constellations, Time
The pointer stars Merak and Dubhe point at Polaris and go once around per sidereal day, every 23 hours 56 minutes and 4 seconds. By making a daily correction it is possible to estimate the time at night using these three stars.
One point on this is pretty much intuitive. What is the Right Ascension of Merak? Well, it’s about the same as Dubhe, because a straight line joins both stars to the axis of the celestial clock, the north celestial pole.
But what is that angle, really? Well, it’s 11 hours of Right Ascension. Or, if you use Daylight Saving Time, it appears to be 12 hours.
Thanks to “reasons”, we now spend at least 7 months of the year on Daylight Saving Time, and this helps to make the Big Dipper Star Clock easier to use. At midnight Eastern Daylight Time on September 21st (most years, September 22nd this year), the Autumnal Equinox, the line between Polaris, Merak and Dubhe points straight down to the northern horizon. At midnight Eastern Daylight Time on March 21st, the Vernal Equinox, the line between Polaris, Merak and Dubhe points straight up to the zenith.
On another day of the year, at the moment when the line joining Merak, Dubhe and Polaris is vertical in either direction, if you know the date, you can make an estimate of the time in Daylight Saving Time.
- Count the number of days before or since September 21 or March 21
- For each day before September 21st, imagine winding your mental clock forward from midnight by 4 minutes. If after September 21st, imagine winding your clock back 4 minutes per day. If your index date is March 21st, use the same directions.
So because tonight is 0 days after September 21st, at the moment tonight when the line between Polaris, Merak and Dubhe points straight down to the northern horizon, you can estimate that it’s about 0*4 minutes before midnight, Eastern Daylight Time. (copy and paste, and replace the zeroes for different dates.)
This system doesn’t work perfectly because it’s the same Daylight Saving Time in Detroit as it is in Boston, although the angles of objects in the sky are different. But it is predictable, if you know that you live east or west of the Central Meridian of your Time Zone, to expect objects in the sky to run reliably fast or slow.
Please refer to the Bradstreet Fulldome Curriculum Vol. 2 Minilesson ‘Time Zones’ and the printed lesson plan in the binder for more detail on time zones. The asterism line representing the Pointer Stars, and the Meridian to show the time when the Pointer Stars are vertical, can be drawn in with Starry Night, and in ATM-4 as well. Please refer to the FDC 2 ‘Hour Angles’ Minilesson and its printed lesson plan to interpret how to use other objects in the sky as a star clock.
Because the Pointer Stars are vertical at (DST) midnight on the Equinoxes, they are terrifically useful for this, but the Minilesson might suggest stars for you that have hour angles that are also convenient to remember for relating to the dates that index our seasons. Right-click on a star and select ‘Hour Angle Lines’ to get a dynamic readout of the time since the last moment it crossed the local meridian to the south. The minilessons ‘Time LAST (Local Apparent Solar Time)’ and ‘Time LMST (Local Mean Solar Time)’ use very similar tools.